


GitHub Commit Graph
Flex your coding frequency
Customizable options
User Name
Your GitHub user handle to generate commit summary
Example: username
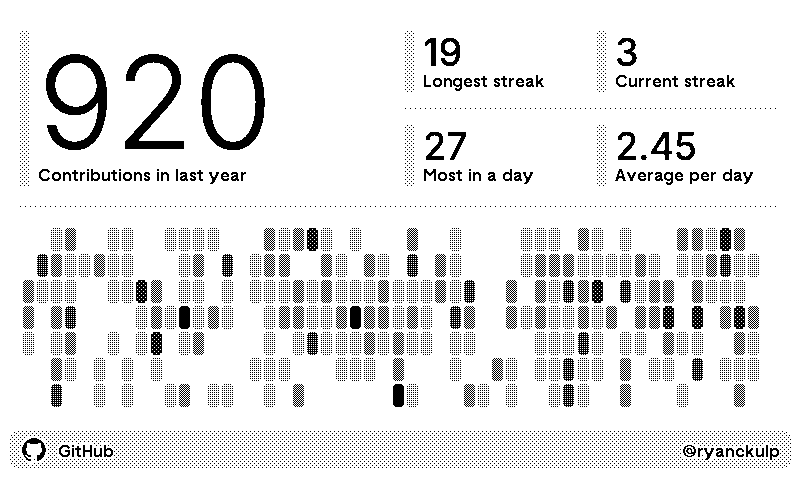
Your GitHub contribution graph, on a TRMNL ePaper display. Enter your GitHub username (no @) and the screen draws the past year of activity as a grid of squares, darker on the days you did more.
Next to it: total contributions in the last year, your longest and current streaks, your busiest day, and your average per day. Nothing to connect and no token needed, just the username. Want a teammate's graph too? Add the plugin again with their username.








Knowledge base Learn about this plugin in our knowledge base
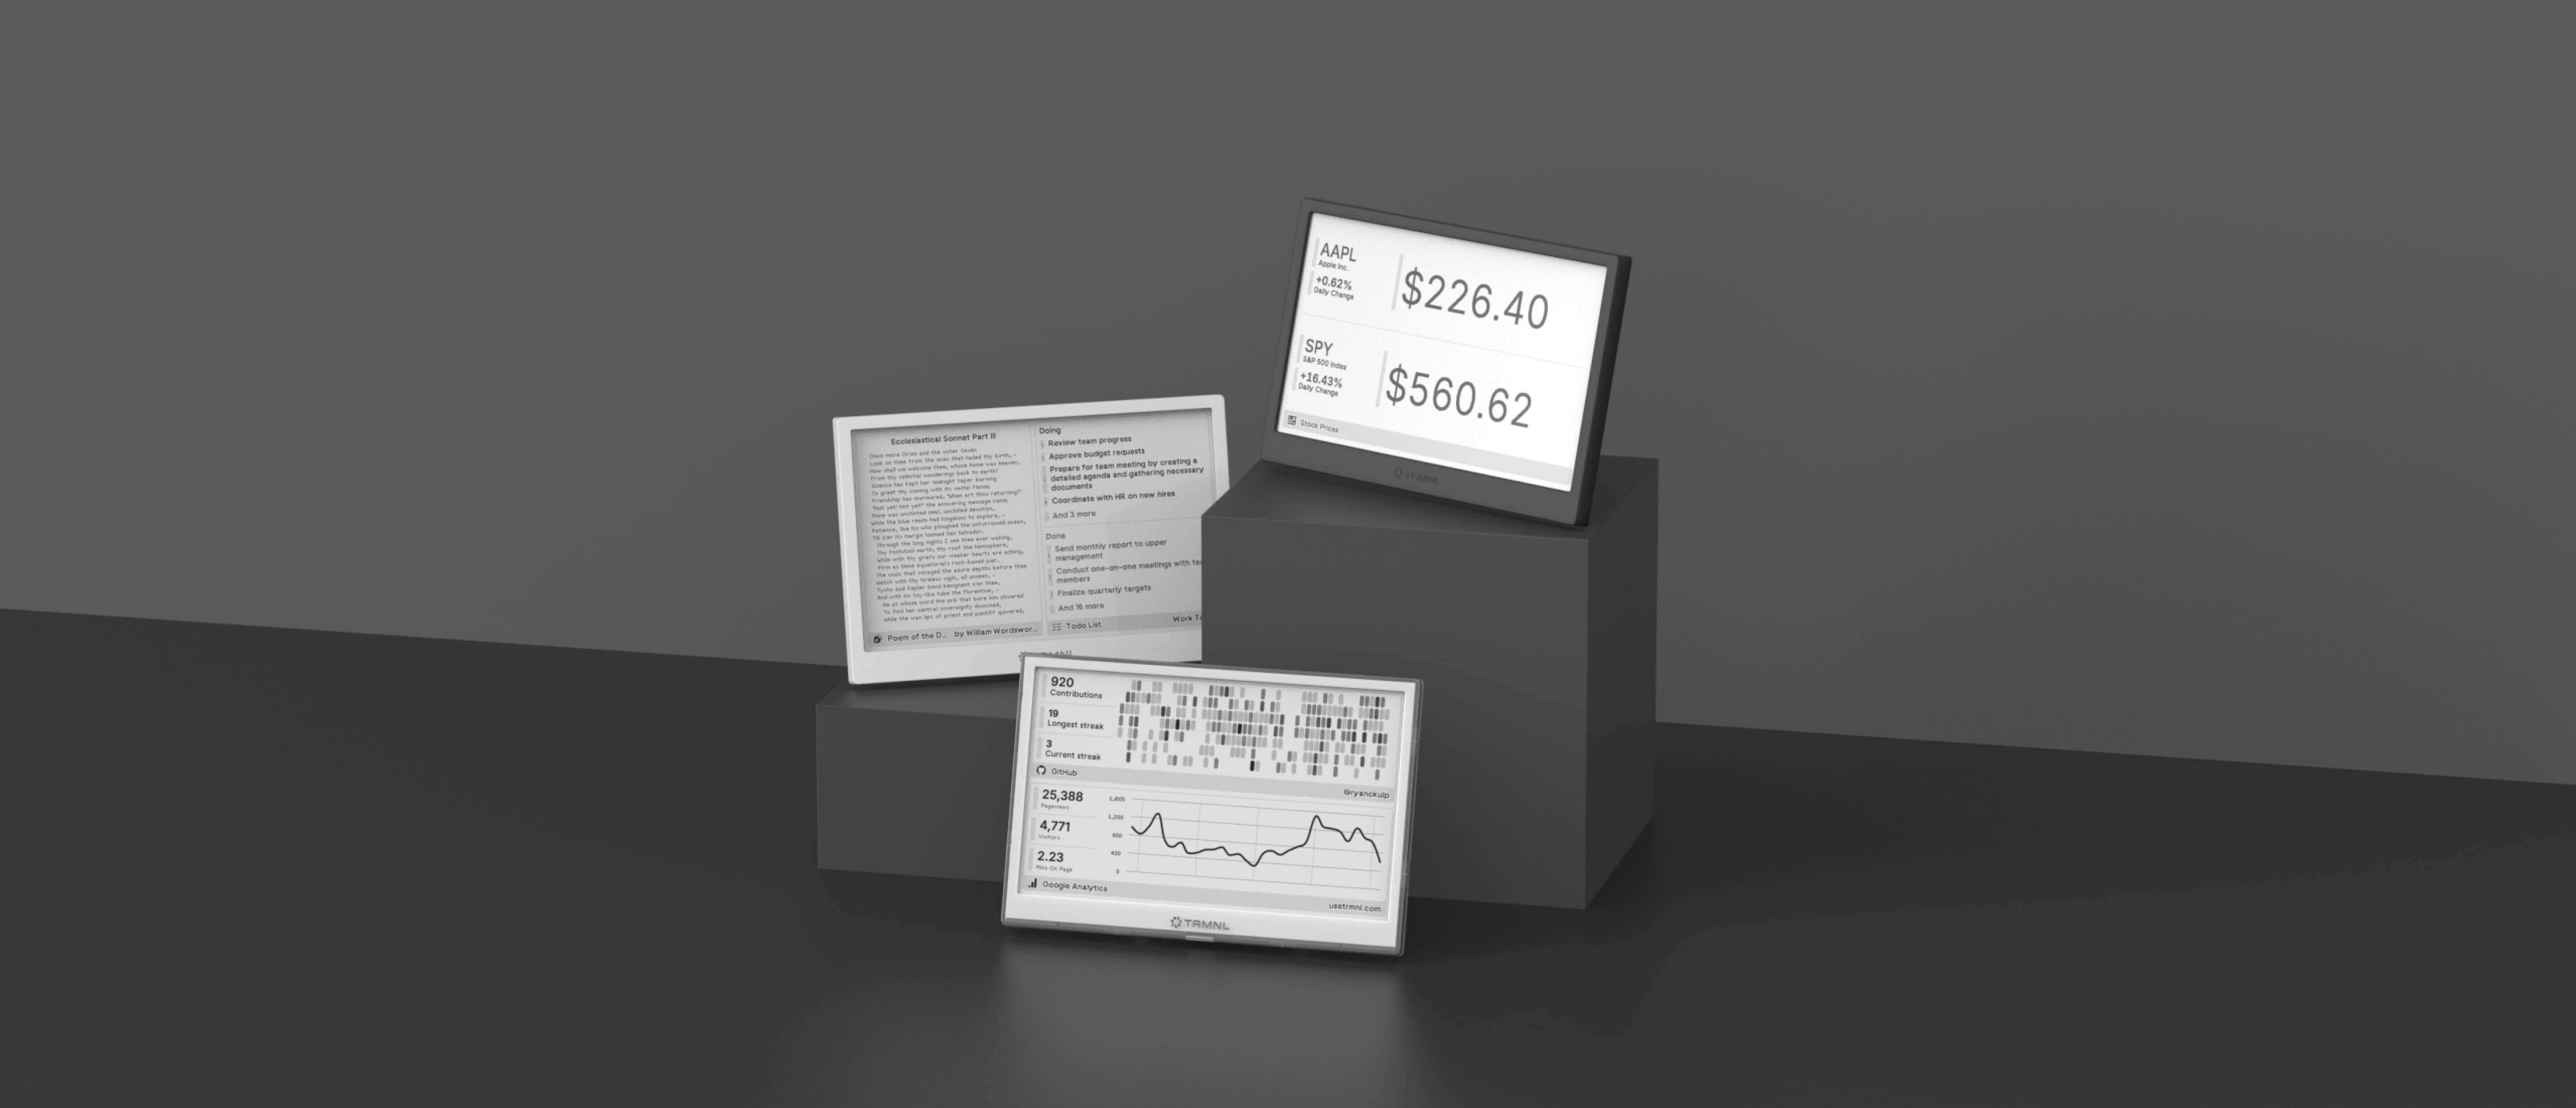
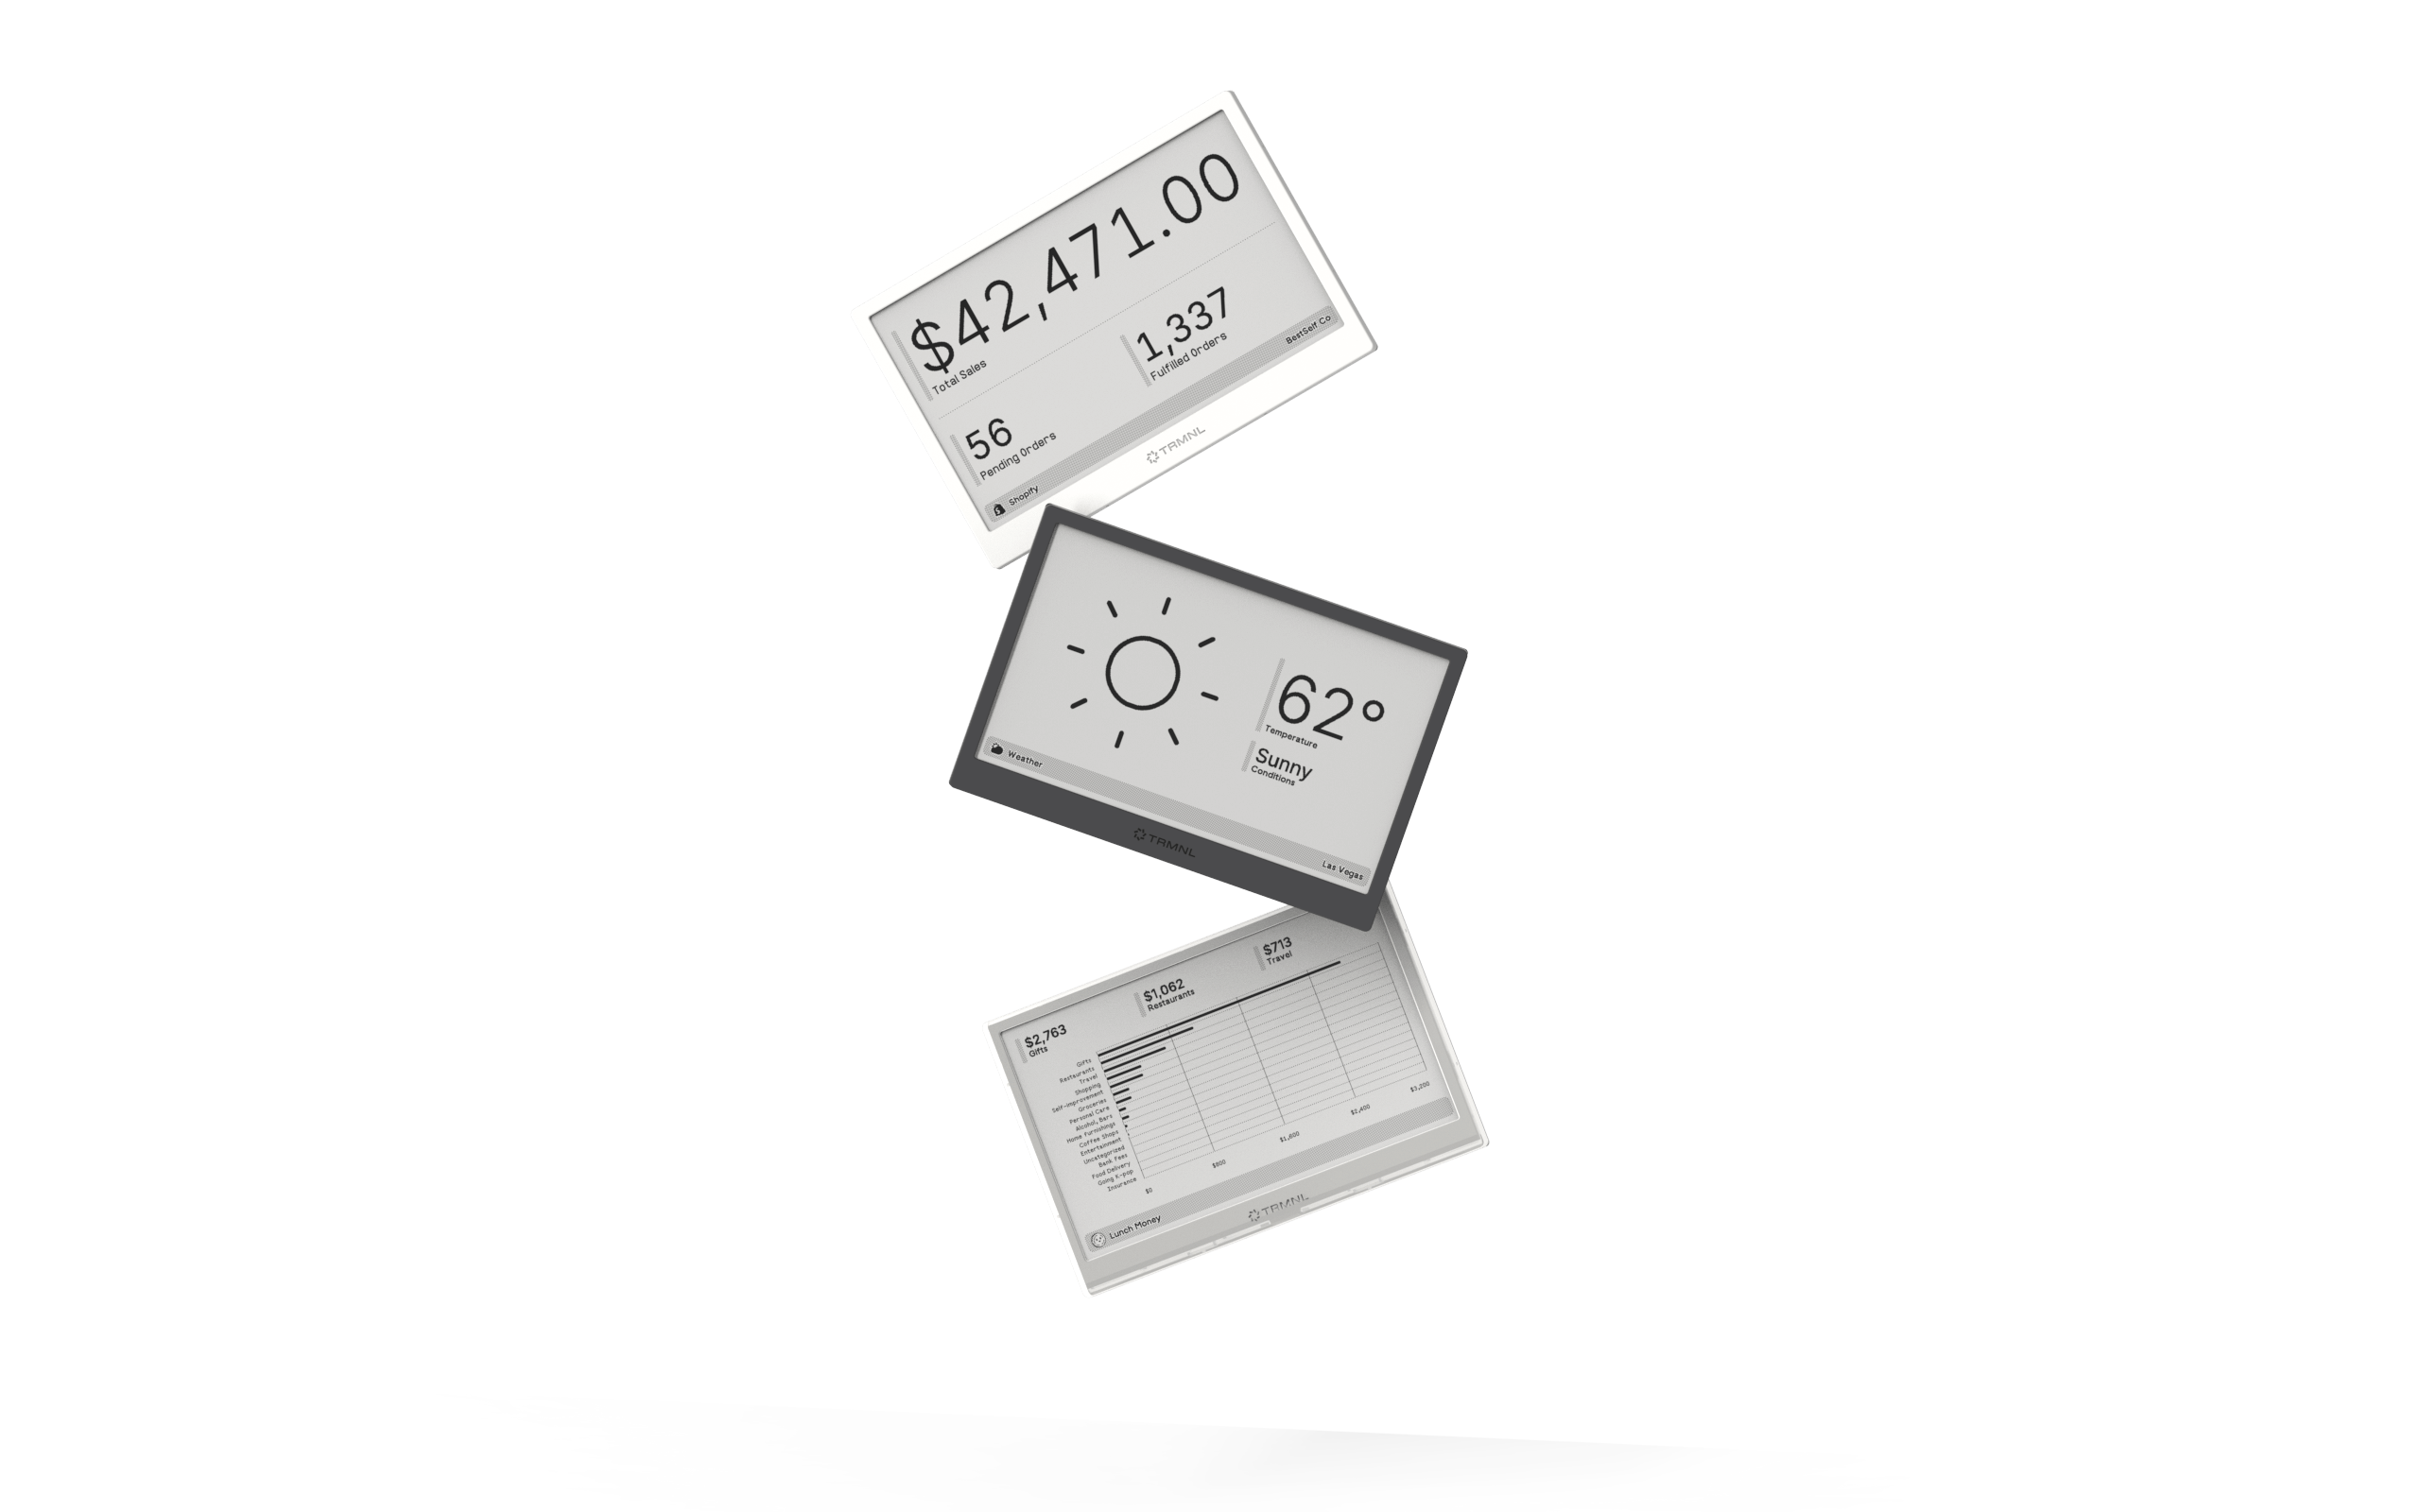
Connect your favorite apps
Our growing library supports work and personal needs, from your daily calendar to upcoming movies. New tools are added weekly.
